
Table of contents
/ping answers is this process alive, /status can it do its job, and
/metrics what has it been doing.
Confusing the first two is expensive. Point readiness at /ping and the
orchestrator sends traffic to a pod that cannot reach its database. Point liveness
at /status and a database blip restarts every replica at once, turning a
degradation into an outage.
/ping
httpserver.WithPingHandlerFunc(jsx.DefaultPingHandler(appInfo))
Returns 200 and the envelope, touching no dependency, running no query, making no
outbound call. A 200 from /ping means the process is running, the listener is
bound, the router works and a goroutine was available to serve the request.
That is what a liveness probe asks. Liveness answers “should this process be killed and replaced”, and a restart only fixes problems inside the process: a deadlock, a wedged goroutine, memory exhaustion. Restarting does not fix an unreachable database, so an unreachable database should not influence this answer.
/status
healthCheckHandler := healthcheck.NewHandler(
	healthchecks,
	healthcheck.WithLogger(l),
	healthcheck.WithResultWriter(jsx.HealthCheckResultWriter(appInfo)),
)
Runs every registered check and aggregates.
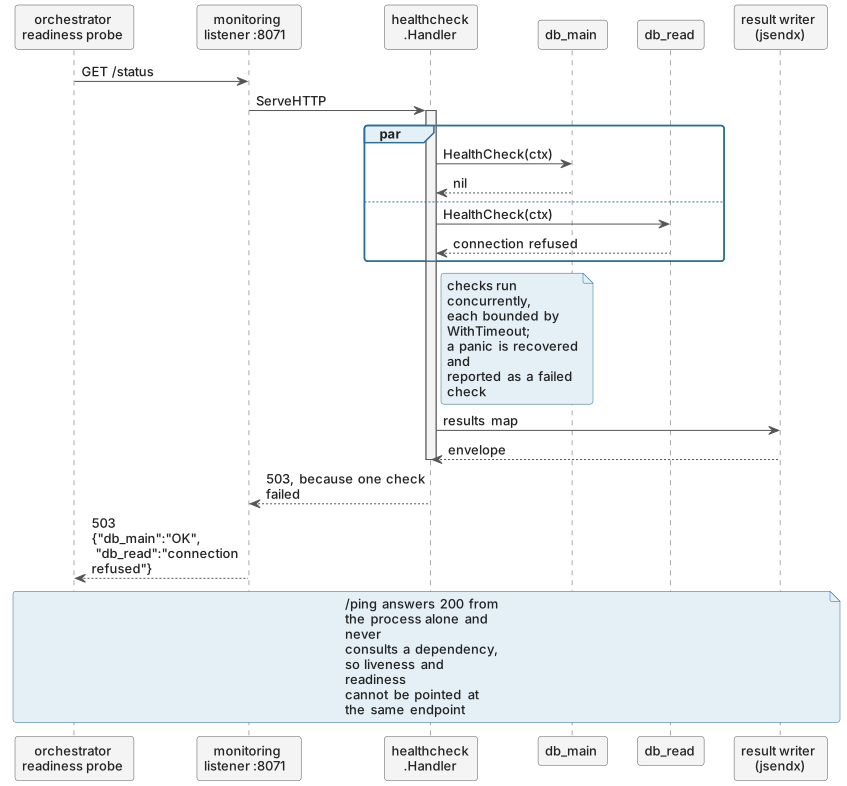
{
  "program": "inventorysvc",
  "version": "1.4.2",
  "release": "873",
  "status": "error",
  "code": 503,
  "message": "Service Unavailable",
  "data": {
    "db_main": "OK",
    "db_read": "dial tcp 10.0.3.14:3306: connect: connection refused"
  }
}
200 when every check passes, 503 when any fails, and the per-check results in both cases. The status code already says the service is not ready; “db_read is refusing connections” says where to look.
Checks run concurrently, so the endpoint takes as long as the slowest check
rather than the sum. WithTimeout bounds each one, which stops a single hung
dependency hanging the probe, and a hung readiness probe is worse than a failing
one because the orchestrator has to wait for its own timeout to decide anything.
A panic inside a check is recovered, logged, and reported as a failure. A health check that panics has told you something is wrong, and taking the process down over it would be the wrong response.
Registration
Every client exposes HealthCheck(ctx) error, so registration is one line:
return sqlConn, append(healthchecks, healthcheck.New("db_"+name, sqlConn)), nil
sqlconn, redis, valkey, sqs, s3, ipify and slack satisfy it
directly. Anything else adapts through HealthCheckFunc, and CheckHTTPStatus
covers an external HTTP dependency.
IDs must be unique and non-empty, because results are keyed by ID and duplicates collapse into one entry. The handler logs a warning at construction when it sees one.
What to check, and what not to
Check what the service cannot serve without. The database is in: if the pool is unreachable, every endpoint that matters returns 500, so the service is genuinely not ready.
ipify is out, and the reference implementation says so where you would look for
it:
// ipify is used only as a diagnostic (the monitoring /ip route); it is
// intentionally not part of the health checks.
Including it means a third party’s bad afternoon takes your service out of rotation. Every replica reports 503, the orchestrator finds no healthy backends, and a service that could serve every request serves none. Health checks are one of the few places where a dependency you do not need can take you down.
The awkward case is a dependency only some endpoints need, such as a read replica only the reporting endpoints use. Its failure should not stop the write path, and one boolean endpoint has no clean answer: either leave it out of readiness and let those endpoints return 503 individually, or split the service. Reporting the whole service unready is the option to avoid.
Two failure modes
Readiness pointed at /ping. The container starts, /ping answers 200
immediately, the orchestrator marks it ready and routes traffic. The database
connection is not up. Every request fails until it is. During a rolling deploy
this is a window of hard failures on every new pod.
Liveness pointed at /status. The database has a thirty-second blip, so
/status returns 503 and liveness fails on every replica. The orchestrator kills
all of them at once, they restart, cannot connect, fail the startup ping from
page 12, and crash-loop. The database recovers to
a thundering herd of restarting pods, and a brief degradation has become an outage
that outlasts its cause.
Page 19 wires both probes into a manifest.
The body is not public
A /status body naming db_read and a private IP address is a description of
your internal topology. It belongs on the monitoring listener, which
page 17 covers, and never on the public
one.
The version and release in the envelope are the same argument at lower stakes: an attacker knowing your exact build knows which published vulnerabilities to try. Whether that matters depends on your threat model, and it is one more reason the detailed status lives behind the monitoring split.
/metrics
httpserver.WithMetricsHandlerFunc(m.MetricsHandlerFunc())
The scrape endpoint. Prometheus text format by default, and 501 until a backend is supplied, so the server package does not depend on a metrics library.
The interface
type Client interface {
	InstrumentDB(dbName string, db *sql.DB) error
	InstrumentHandler(path string, handler http.HandlerFunc) http.Handler
	InstrumentRoundTripper(next http.RoundTripper) http.RoundTripper
	IncLogLevelCounter(level string)
	MetricsHandlerFunc() http.HandlerFunc
	SqlOpen(driverName, dsn string) (*sql.DB, error)
	Close() error
	// ...
}
Inbound HTTP, outbound HTTP, SQL queries, connection pools, log levels and the
scrape endpoint. The default implementation is a no-op that still returns a
working *sql.DB, so a service runs with no metrics backend and the call sites do
not change.
Custom collectors
func New() *Client {
	return &Client{
		collectorExample: prometheus.NewCounterVec(
			prometheus.CounterOpts{
				Name: NameExample,
				Help: "Example of custom collector.",
			},
			[]string{labelCode},
		),
	}
}

func (m *Client) CreateMetricsClientFunc() (metrics.Client, error) {
	var err error

	opts := []prom.Option{
		prom.WithCollector(m.collectorExample),
	}

	m.libClient, err = prom.New(opts...)

	return m.libClient, err
}
New builds the service’s own collectors. CreateMetricsClientFunc builds the
backend and registers them, called by bootstrap during startup, per
page 03.
The split exists for ordering: bind needs the collectors before the backend
exists, because the wiring that uses them runs first.
The guard that follows:
func (m *Client) InstrumentDB(dbName string, db *sql.DB) error {
	if m.libClient == nil {
		return errMetricsClientNotInitialized
	}

	return m.libClient.InstrumentDB(dbName, db)
}
An explicit error rather than a nil dereference. Calling in the wrong order gives you a message naming the mistake instead of a panic in a goroutine.
Cardinality
Every distinct combination of label values is a separate time series, stored separately, held in memory by the scraper. A label whose values are unbounded produces unbounded series.
// Wrong: one series per item, forever.
m.requestCounter.With(prometheus.Labels{"path": r.URL.Path}).Inc()

// Right: one series per route.
m.requestCounter.With(prometheus.Labels{"path": routePattern}).Inc()
This is why InstrumentHandler takes args.Path, the registered pattern, and
why page 08 made a point of it. Bounded label
values: method, status code, route pattern, database name. Unbounded: user IDs,
item IDs, raw paths, error message strings, anything from a request body.
The failure is not immediate: a scraper whose memory grows over weeks until it falls over, and then a query to work out which metric did it.
Correlation is not tracing
Page 06 built trace ID propagation: read
X-Request-ID, put it in the context, log it, forward it. That is correlation.
Given an ID you can find every log line across every service for one request.
Distributed tracing adds three things correlation does not have.
Spans. A request becomes a tree of timed operations. Not “these twelve log lines belong together” but “the handler took 340ms, of which the availability call took 280ms, of which 240ms was waiting for a connection”.
Causality. Each span records its parent, so the tree shows which call caused which, including across service boundaries.
Sampling. Tracing every request at high volume is expensive to transmit and store, so a sampling decision is made, propagated, and honoured consistently by every service in the path. Correlation has no equivalent because a log line is cheap.
W3C traceparent is the standard header:
traceparent: 00-4bf92f3577b34da6a3ce929d0e0e4736-00f067aa0ba902b7-01
Version, trace ID, parent span ID, and flags whose low bit is the sampling
decision. Your X-Request-ID is a service-specific convention; traceparent is
what a collector and every OpenTelemetry SDK understand. Carrying both is normal
and costs one header.
Turning tracing on
The interface makes this a swap rather than a project.
// Prometheus, in internal/metrics/metrics.go
m.libClient, err = prom.New(opts...)

// OpenTelemetry
m.libClient, err = opentel.New(opentel.WithServiceName("inventorysvc"), ...)
opentel implements the same metrics.Client interface with OpenTelemetry for
both metrics and tracing. It configures and registers the global tracer, meter
and propagator, creates the default counters, and records shutdown functions so
Close flushes the exporters.
What that gives you, without any other change to the service:
InstrumentHandler starts a server span per request, extracting the parent from
the incoming traceparent. InstrumentRoundTripper starts a client span per
outbound call and injects traceparent into the outgoing headers.
SqlOpen and InstrumentDB go through otelsql, so queries become spans with
the statement attached. The propagator is registered globally, so anything using
the OpenTelemetry API in the process participates.
Those are the seams pages 09, 11 and 12 already put instrumentation on. Each becomes a span, and nothing in the handler, the service layer or the repository moves.
Exporters are selected from the environment:
OTEL_EXPORTER_OTLP_ENDPOINT=http://otel-collector:4318
OTEL_SERVICE_NAME=inventorysvc
OTEL_SERVICE_VERSION=1.4.2
OTEL_DEPLOYMENT_ENVIRONMENT_NAME=production
OTEL_RESOURCE_ATTRIBUTES=team=platform
With no endpoint set it exports to stdout, which is how you check locally that spans are being produced without running a collector.
statsd is the third implementation, for a platform that speaks StatsD.
OpenTelemetry is not necessarily the right answer; the point is that the boundary
was drawn at an interface, so the answer is changeable. A service calling
prometheus.NewHistogram directly from thirty handlers turns the same decision
into a migration project.
What the swap does not cover
Page 08’s boundary rule applies here too.
The process must create spans. Nothing downstream can invent a span the service never started. A collector cannot reconstruct that the availability call took 280ms if nobody timed it. This half is in-process and cannot be delegated.
The platform usually owns collection and sampling. A Collector receives OTLP, batches it, applies a sampling policy, and forwards to a backend. The policy wants to be platform-wide: a head-based decision is made once at the entry point and honoured by every service, or you get partial traces. Configuring it per service produces exactly that.
So the service creates spans, propagates context, and sets the exporter endpoint from the environment. The collector, the sampling policy, the retention and the query interface are the platform’s.
/metrics is the same shape. The service exposes it. The scrape interval, the
retention, the recording rules and the alerts belong to the monitoring platform.
pprof
httpserver.WithEnableAllDefaultRoutes()
includes /pprof/*, which is Go’s runtime profiler over HTTP. Bridged onto the
router through a single wildcard route rather than registering each pprof handler
by hand.
go tool pprof http://localhost:8071/pprof/heap
go tool pprof http://localhost:8071/pprof/profile?seconds=30
curl http://localhost:8071/pprof/goroutine?debug=2
This answers what metrics cannot: where the allocations are, from the heap profile; where the CPU time goes, from a CPU profile; and what every goroutine is blocked on, from the goroutine dump, which is the fastest way to diagnose a service that has stopped responding.
Two costs. A CPU profile adds measurable overhead while it runs, so profiling under load is a deliberate act. And these are the most dangerous endpoints the service has: a heap profile can contain fragments of anything the process held in memory. Monitoring listener only.
The dashboard
resources/grafana/dashboard.json ships with the reference service and is a
reasonable starting point rather than a finished answer.
What belongs on the first screen, in the order you look at it during an
incident: request rate and error rate by route, latency percentiles including
the 99th, error and warning log counts from
page 06’s per-level counter, and the connection
pool metrics from page 12, particularly
WaitCount.
Percentiles rather than averages. An average response time of 50ms is consistent with everything being fine and with 5% of requests taking two seconds, and users report the second one.
Next: Designing the Feature: Contract, Schema, Seams, which starts Part V.